
This app allows you to view the performance data previously collected by the ACD.
The following rules apply to the collection and storage of statistical data:
-
The innoACD calculates a data record per queue or team and hour with performance data on availability, call volume, and processing.
-
The data records are stored in the PostgreSQL database of the innovaphone AppPlatform.
-
Data records consisting solely of zeros are not saved.
-
Every 10 minutes, each data record is temporarily stored. In the event of a brief system failure, historical data for a maximum of 10 minutes will be lost.
-
Call-related performance data is recorded in the time interval in which the process was completed, even if the process began in a previous time interval.
The key data for the statistics to be compiled are entered using the following screen

Die speicherten Daten können nach folgenden Kriterien aufbereitet werden
|
Wert |
Beschreibung |
|---|---|
|
Interval |
The temporal resolution of data processing. Hourly is the finest resolution.
Following intervals are available:
|
|
Start Date |
Filter condition for the first date of the day with records |
|
End Date |
Filter condition for the last date of the day with records |
|
Start Hour |
Filter condition for the first hour per day with data records. One hour comprises minutes 0 to 59. This means that hour 0 runs from 00:00:00 to 00:59:59. |
|
End Hour |
Filter condition for the last hour per day with data records. |
|
Report type |
Determining whether queue or team statistics should be created |
|
Queues / Teams |
Selection of queues or teams for statistics |
The export function allows you to transfer the previously visualized data to a CSV file for external processing.
Key Metrics
Queue Statistics
The following table describes the individual metrics in a queue report.
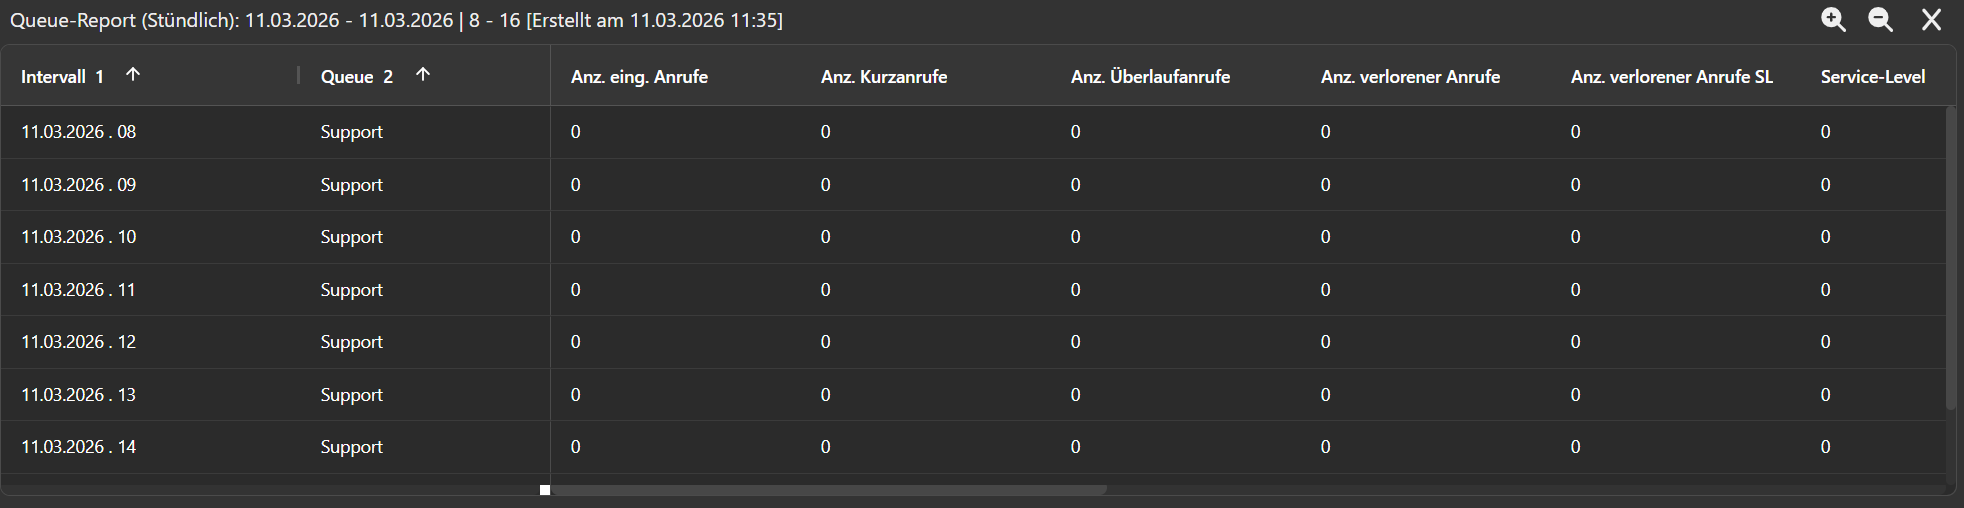
|
Metric |
Description |
Example |
|---|---|---|
|
Interval |
Time window for which the metrics are aggregated. Depending on the report, this may be hourly, daily, or another time interval. Each row in the report refers to a specific interval. |
, hour 10 (10:00–10:59) |
|
Queue |
Name of the queue to which the metrics refer. Each queue is evaluated separately for each time interval. |
Support |
|
Number of Incoming Calls |
Total number of calls received by this queue during the selected period. A call is counted as soon as it enters the queue. |
25 incoming calls |
|
Number of Short Calls |
Number of calls shorter than the system-wide short call duration. This duration is configured in AC Admin using the Short call timer parameter. A call is considered a short call if the caller hangs up within this period, regardless of whether the call is still waiting in the queue or has already been connected to an agent. Short calls are not counted as lost calls, do not negatively affect the service level, and do not generate after-call work time for the agent. |
3 short calls (≤ 3 seconds) |
|
Number of Overflow Calls |
Number of calls routed out of the queue according to configured rules. This may occur, for example, when the maximum waiting time is reached or another destination is selected in a DTMF menu. |
5 calls forwarded to another queue |
|
Number of Lost Calls |
Number of calls that left the queue without being answered by an agent. This is usually because the caller hung up while waiting. |
4 lost calls |
|
Number of Lost Calls within the Service Level Time |
Number of calls lost within the defined service level time window, before the maximum response time configured for the service level was exceeded. These calls negatively affect the service level. The underlying service level threshold is defined separately for each queue in AC Queue Admin, under Monitoring, using the parameter for the required service level response time. |
2 SLA-relevant lost calls |
|
Service Level |
Proportion of calls answered within a defined target waiting time. The value is shown as a percentage and is a key performance indicator for service quality. |
82% of calls answered within 20 seconds |
|
Number of Contacts |
Number of calls successfully answered by agents. A contact is recorded as soon as an agent answers the call. |
21 answered calls |
|
Average Handling Time |
Average time an agent needs to handle a contact. This includes talk time and after-call work time. |
3 minutes 15 seconds |
|
Maximum Handling Time |
Longest handling time for a single contact within the selected interval. This metric helps identify particularly long calls or complex cases. |
12 minutes 40 seconds |
|
Average Waiting Time |
Average time callers spent waiting in the queue before being connected to an agent or abandoning the call. |
45 seconds |
|
Maximum Waiting Time |
Longest waiting time for a single caller in the queue within the interval, regardless of whether the call was answered or abandoned. |
One caller waited for a maximum of 4 minutes 10 seconds |
|
Average Waiting Time of Lost Calls |
Average waiting time of callers who hung up before an agent became available. This metric shows how long customers typically wait before giving up. |
Callers who hung up waited an average of 1 minute 30 seconds |
|
Maximum Waiting Time of Lost Calls |
Longest waiting time of a caller who eventually hung up without being connected to an agent. |
One caller waited for 6 minutes 20 seconds and then hung up |
|
Availability |
Total available time of all agents during this interval. Only periods in which agents were in the Available status and could take calls are included. Talk time is also included. The times of all agents are added together. |
5 agents available for 30 minutes each → 150 minutes of total availability |
Team Statistics
The following table describes the individual metrics in a team report.
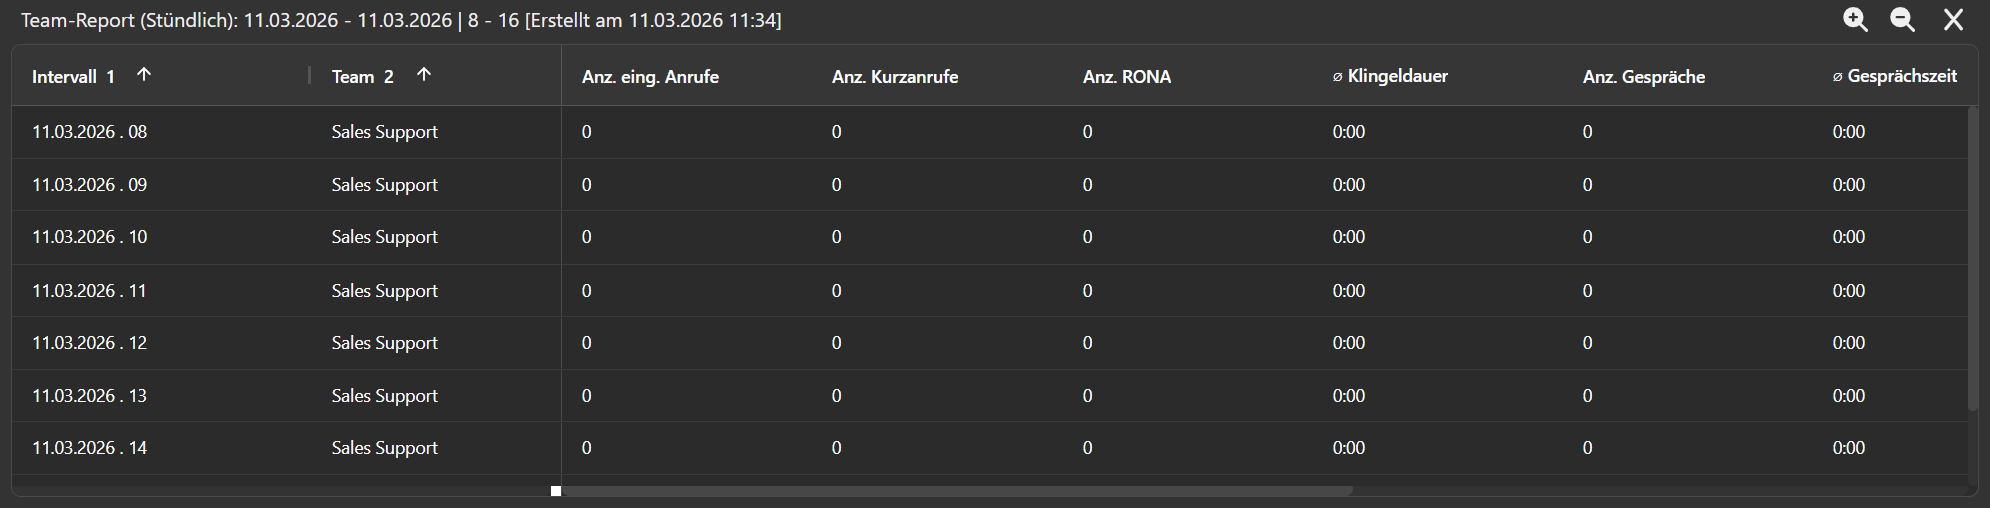
|
Metric |
Description |
Example |
|---|---|---|
|
Interval |
Time interval for which the statistics are calculated. Results are aggregated for this period, for example hourly or daily. |
, hour 9 |
|
Team |
Name of the team whose activities are evaluated. All agents assigned to this team are included in the calculation. |
Sales Support |
|
Number of Incoming Calls |
Total number of incoming calls assigned to the team during the selected period. |
35 incoming calls |
|
Number of Short Calls |
Number of calls whose talk time is below the defined short call duration. |
4 calls with less than 5 seconds of talk time |
|
Number of RONA Calls |
Number of calls redirected due to RONA (Redirect On No Answer) because an agent did not answer within the configured ring time. |
3 calls routed to another agent after the ring time expired |
|
Average Ring Time |
Average time a call rang at an agent before it was answered or redirected. |
6 seconds on average |
|
Number of Answered Calls |
Number of calls actually answered by agents in the team. |
28 answered calls |
|
Average Talk Time |
Average duration of all calls handled by agents in the team. |
Average talk time of 3 minutes 45 seconds |
|
Maximum Talk Time |
Longest duration of a single call handled by the team during the selected period. |
Longest call: 12 minutes 30 seconds |
|
Total After-Call Work Time |
Total time agents in the team spent on after-call work. |
25 minutes of after-call work in total |
|
Login Duration |
Total time agents in the team were logged into the system, regardless of their status. |
Agents were logged in for a combined total of 7 hours |
|
Availability |
Total time agents in the team were in the Available status and could take calls. |
5 hours of available time |